
Single Value Threshold from Image Histogram – Image Segmentation
Single value thresholding is a very important part of image segmentation. There are several use of image thresholding. One of the most common use is to generate a black and white image from any image.
What is Image Thresholding?
Thresholding or Image Thresholding is a process to dividing the total element or image into multiple segment depending on some values in the range. For example, if you want to threshold a grayscale image you can differentiate the image into two segment, one which is nearly black and another which is nearly white.
What is Segmentation?
Segmentation or image segmentation is a process for dividing something on any basis. Whether you threshold an image or crop an image both are segmentation.
As here we can find different segment using thresholding so, we can define thresholding as a technique of segmentation.
Note that, each thresholding is a kind of segmentation but each segmentation is not a thresholding. For example, cropping image is segmentation but not thresholding.
What is Single Value Threshold?
Single value threshold is a kind of image thresholding where we threshold the image on the basis of a single point or line. That means after applying single value threshold we get two segment of the image. For example, if we segment a grayscale image we get two segment: black and white.
What is Image Histogram?
Histogram or Image Histogram is a kind of graphical representation where the frequencies are represented as related to image bit level. In a histogram there are two axis: one is for frequency and another is for image bit level.
If you try to find a histogram of a grayscale image you should think about the bit level of the image. As the image is in grayscale so the bit level means how closer it is to black or white. If the value is so closer to 0 then the color is closer to black. Or we can say if the color is closer to black the value of bit level will be closer to 0. In case of color closer to white refers to values near the highest bit level.
In grayscale image, bit values are from 0 to 255. In binary those are,
00000000 and 11111111 respectively.
So, the bit levels are from 0 to 255.
Each line on the image histogram represents how may pixels are there in a specific bit level.
If you have a 25×25 size pure black image, that means you have 625 value in frequency domain at 0 on the bit level domain.
If you have a pure white image of 25×25 size than you will see 625 value in frequency domain at 255 on the bit level domain.
Other bit level values have the frequencies that appears in the respective bit levels.
Single Value Thresholding of Image Histogram in MATLAB
It is very simple if you have understood previous programs of MATLAB and image processing. The below program shows single value thresholding technique from image histogram.
ColorImage = imread('OriginalImage.jpg');
figure;
imshow(ColorImage,'InitialMagnification','fit');

Grayscale = rgb2gray(ColorImage);
figure;
imshow(Grayscale,'InitialMagnification','fit');

figure;
imhist(Grayscale);

[height, width] = size(Grayscale);
ThresholdedImage = zeros(height,width);
for i=1:height
    for j=1:width
        if(Grayscale(i,j)>80)
            ThresholdedImage(i,j)=1;
        end
    end
end

figure;
imshow(ThresholdedImage, [0,1],'InitialMagnification','fit');

figure;
imhist(ThresholdedImage);
Explanation of MATLAB Code
To understand reading image as input, showing image as output and converting a RGB image into grayscale please see the previous tutorial.
Here I will explain starting from generating a histogram. Before generating a histogram let’s see the image once. You can use any image but it is recommended to use not too dark or not to bright image. I have used the below image for thresholding and histogram.
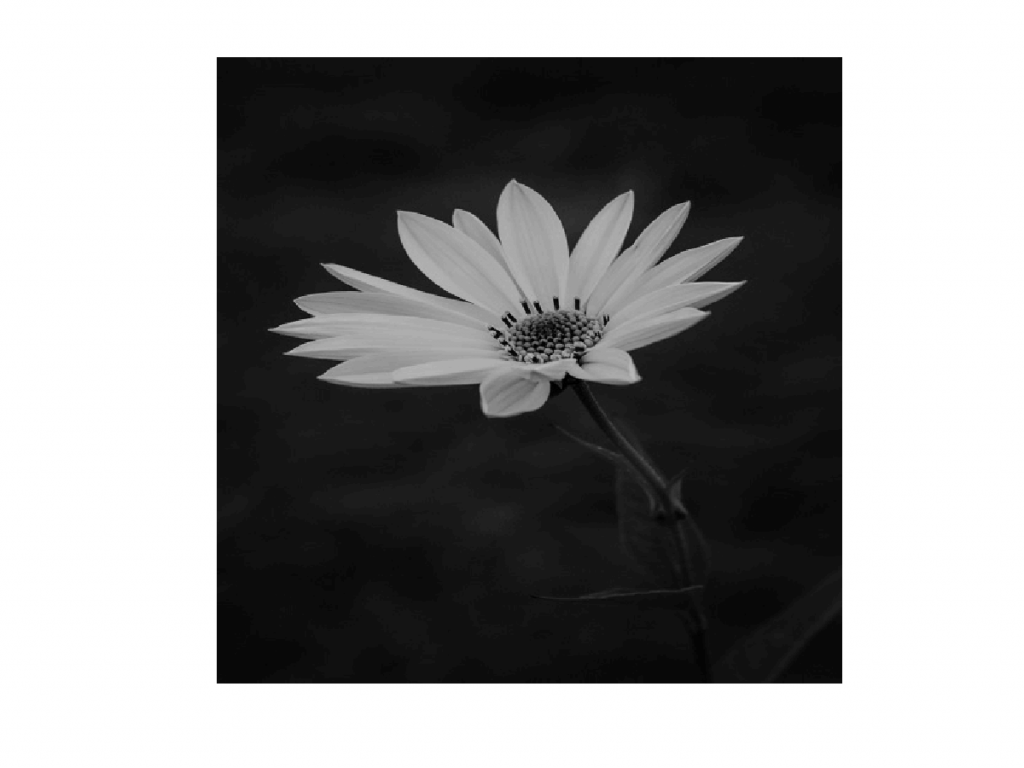
Image Histogram in MATLAB
MATLAB has a built-in function to generate image histogram. But you can use loop to find the value of each pixel. Using loop is time consuming and maybe very hard to trace your code when your image have too high resolution. I am developing the histogram with the function here. In the code above,
figure;
imhist(Grayscale);
The histogram function generates and prints the histogram at the same time. So, you have to prepare a figure for output. The histogram of the above image is look like:
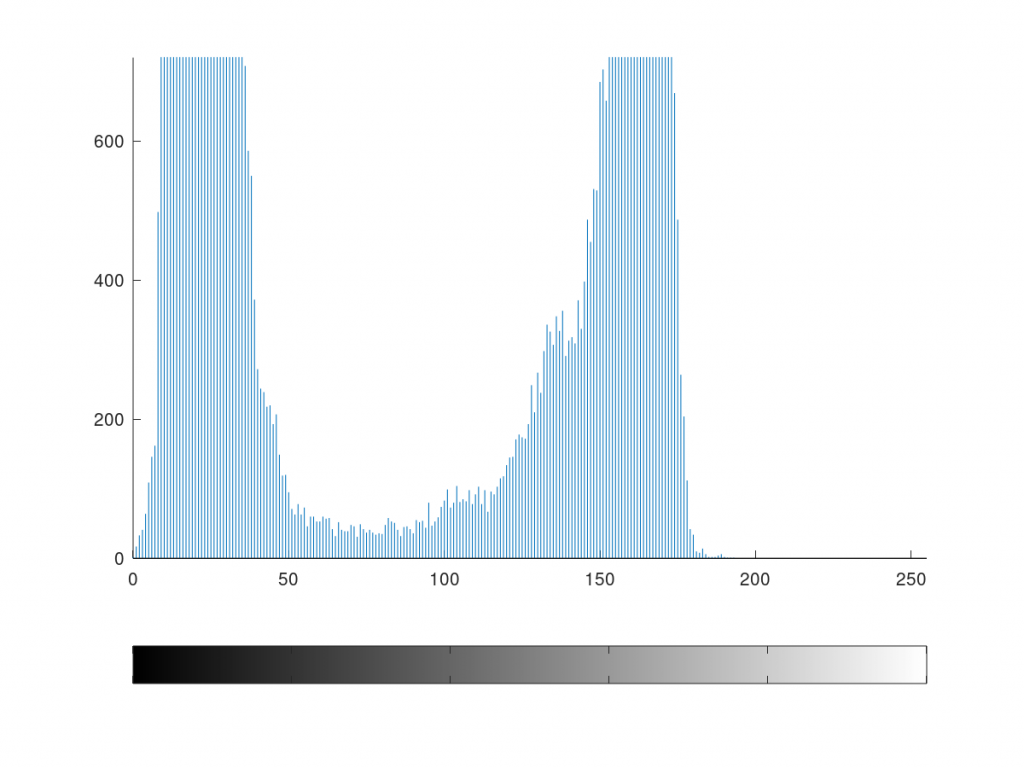
How to Find the Threshold Value from Histogram?
Look at the image above. There we can see frequencies have gathered at two specific range. So, we can easily decide that those two segment are different. So, we have to keep the difference existed whatever we do. We should focus on mid values those have lower values than other frequencies in both side.
If we see carefully than we can see the lower values in the middle values are between range of 60 to 90. So, we can apply any of the values between this range. The values won’t be much different. If you use the lower values in threshold that means you will find some additional pixels on high bit level i.e. in white. On the other way if you use a higher threshold value than you will find some extra black pixels.
We can threshold the histogram at bit value 80 at the point showed below.
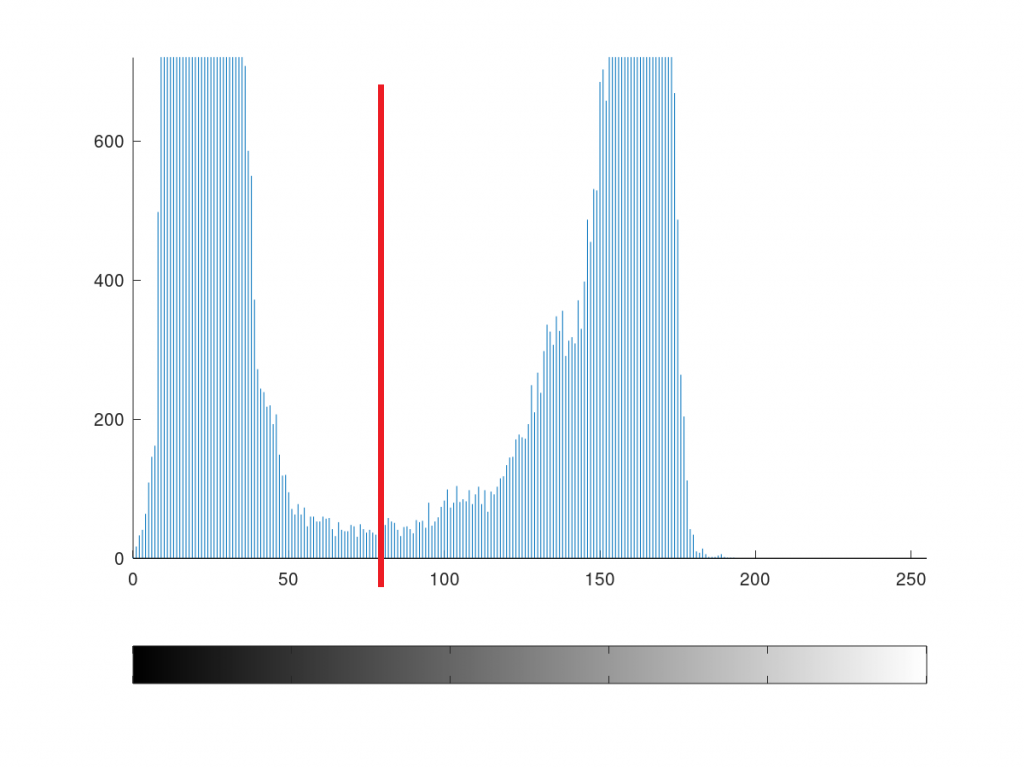
So, we will find all the pixels left to the red line as black and all the pixels right to the red line as white. Let’s segment the image as the thresholding value 80 in MATLAB.
Thresholding a Image in MATLAB
To threshold the image we need to apply the threshold value to compare with each bit. If the value is less than threshold value we will make it 0, if the value is higher than the threshold value then we will make it 1.
Note that, we don’t need to use 255 after thresholding because after thresholding we will get a black and white image. And a black and white image can be represented with a single bit.
To go to the process we need to find the size of image first. So, the below line is used.
[height, width] = size(Grayscale);
Then we have assigned zeroes to all values in a new image named Thresholded Image.
ThresholdedImage = zeros(height,width);
After that we have used two loop (one is nested) to assign the required ones to the Thresholded Image.
for i=1:height
    for j=1:width
        if(Grayscale(i,j)>80)
            ThresholdedImage(i,j)=1;
        end
    end
end
In the loop we have compared the bit level value of each pixel in the image. If it is greater than 80 then we have assigned 1 to the same pixel position on Thresholded Image.
As our current high bit is 1 so, we will show the Thresholded Image from bit range 0 to 1. Following command did this.
figure;
imshow(ThresholdedImage, [0,1],'InitialMagnification','fit');
The Thresholded Image will be like below:

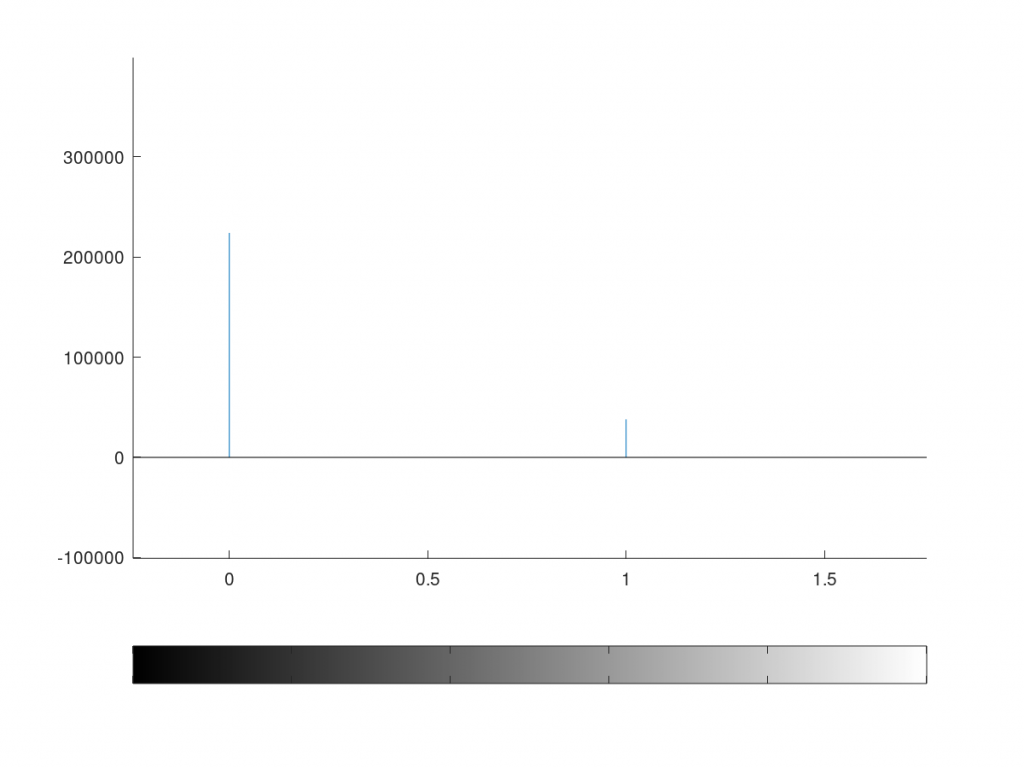
After converting an image to a black and white image there are only black and white. And bit levels are either 0 or 1. So, if you generate a histogram again you will see the frequencies are gathered at 0 and 1.
So, hope you have understood Single Value Thresholding well. If you enjoyed this tutorial please comment here.