
How to Modify Spatial Resolution of a Grayscale Image in MATLAB?
Spatial Resolution is the total number of pixels in the picture. If the spatial resolution is good the image is more clear. Whether a image is zoomed out or zoomed in total number of pixels are unchanged. So, the spatial resolution is always constant for a specific image. It doesn’t change with zooming.
Modifying spatial resolution means either decreasing spatial resolution or increasing resolution. Decreasing spatial resolution means that you are combining multiple pixels to form a new pixel. Increasing spatial resolution means you are splitting pixels into multiple pixels.
Modifying Spatial Resolution in MATLAB
The below example shows an example of decreasing spatial resolution of a grayscale image. To increase spatial resolution again you just need to reverse the while loop.
ColorImage = imread('OriginalImage.jpg');
figure;
imshow(ColorImage,'InitialMagnification','fit');

Grayscale = rgb2gray(ColorImage);
figure;
imshow(Grayscale,'InitialMagnification','fit');

[height, width] = size(Grayscale);
Resizefactor = 0;

figure;
while Resizefactor<=8
    ReducedImage = Grayscale(1:2^Resizefactor:height, 1:2^Resizefactor:width);
    subplot(3,3,Resizefactor+1)
    imshow(ReducedImage);
    title(256/2^Resizefactor);
    Resizefactor = Resizefactor + 1;
end
Explanation of the Code
In the below portion I have explained the whole MATLAB code line by line. So, read full article to understand it better.
ColorImage = imread('OriginalImage.jpg');
Here ‘ColorImage’ is a variable where we have assigned an image. In MATLAB an image is nothing but a multi-dimensional array. If the image is in RGB format it is a 3-dimesional array. There can have any more additional dimension such as intensity, brightness etc.
If the image is in grayscale that means that is a 2-dimensional array. If not defined the level of grayscale is 256. That means the highest value of each pixel element in a grayscale image can be at most 256-1 or 255.
A Black and White image is also a 2-dimensional array. But in that case the image level or gray level is 2. That means the highest value of each pixel element can be 1. So, we have two values in black and white image those are 0 and 1. And for this reason this is called binary image and need only one bit to represent each pixel.
However here imread(); is a function to read the image. In this function we must use a parameter containing image location including name and extension.
So, the above instruction reads a color image named ‘OriginalImage.jpg’ from the same folder of the program. Note that, image names are case sensitive.
figure;
Figure is an instruction to create a frame to display figure.
imshow(ColorImage,'InitialMagnification','fit');
Here imshow is a function which shows the image as output. Later two optional parameter has been added. You can skip both are keep them. The first parameter of imshow function is the image that will be displayed. The second parameter ‘InitialMagnification’ means the initial size of figure window. And the third parameter ‘fit’ force the image to be fit with the window. As the resolution is changed so, these parameters are need in this case if you see the pictures individually. But if you show in subplot you can skip last two parameters. The output is like below.

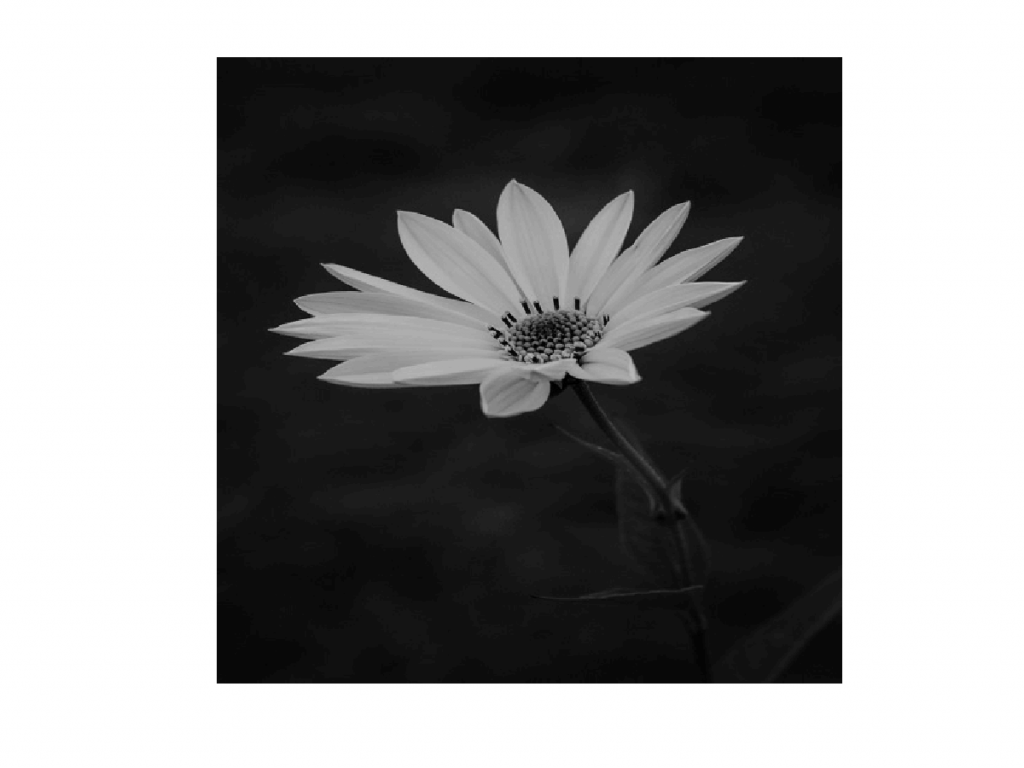
Grayscale = rgb2gray(ColorImage);
Here rgb2gray is a function to convert an RGB image into a grayscale image. So, in this line you have converted the ColorImage into an grayscale image and assigned that to Grayscale variable.
imshow(Grayscale,'InitialMagnification','fit');
This line prints the grayscale image as usual. The output is like below.
[height, width] = size(Grayscale);
Resizefactor = 0;
Here [Height, width] is a variable set or 2-dimensional variable. You can assign a multidimensional value in variable. Here height and width are assigned to the number of rows and number of columns in the image matrix.
Resizefactor is another variable which will be used for scaling on the basis of spatial resolution. We will adjust 2Resizefactor number of pixels to form a single pixel.
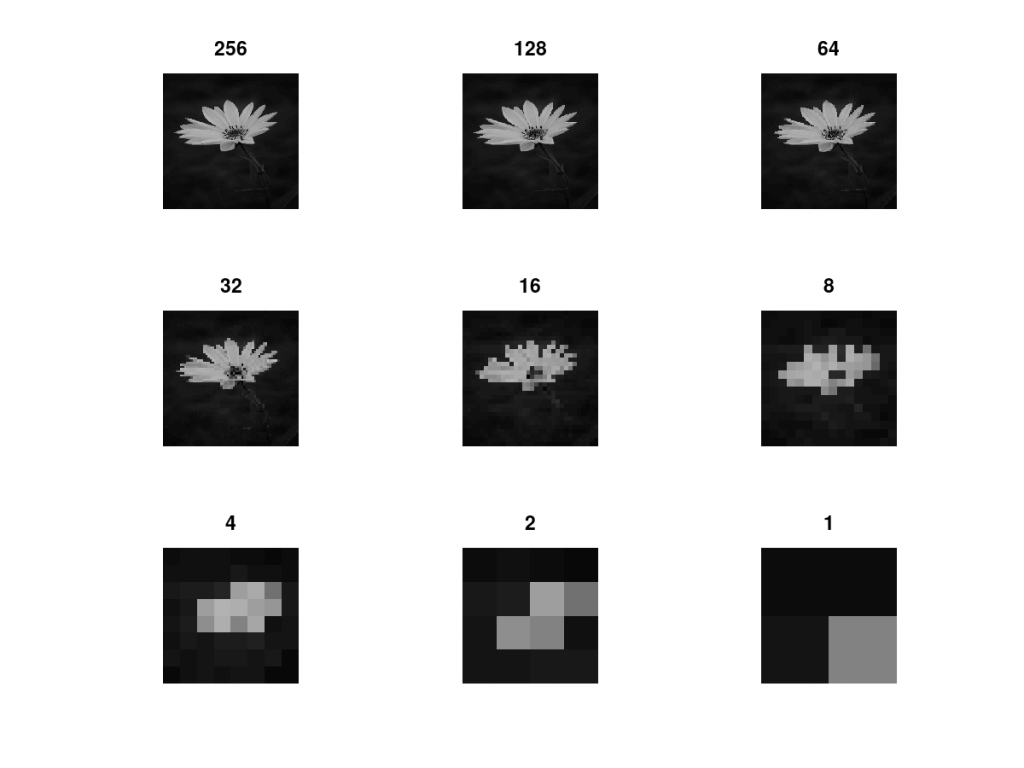
while Resizefactor<=8
    ReducedImage = Grayscale(1:2^Resizefactor:height, 1:2^Resizefactor:width);
    subplot(3,3,Resizefactor+1)
    imshow(ReducedImage);
    title(256/2^Resizefactor);
    Resizefactor = Resizefactor + 1;
end
This is a while loop to decrease the spatial resolution continuously. Here we have turned the loop for Resizefactor=0 to 8. That means the loop is turned for 9 times.
The second line did the main job. Here we have combined 2Resizefactor number of pixels and formed a new image each time.
We created a 9×9 subplot on third line to display images for all the 9 turns. The subplot index are from 1 to 9.
The we used the imshow function to show the image.
After that we show a title defining what is the spatial resolution level of the image.
And then we have increased the value of Resizefactor to decrease more spatial resolution. And finally we have reached to end of the loop.
The output will look like below.
Hope you understood everything. So, feel free to have a comment.